Please find below the statistics for adult education students served in the Hudson Valley in fiscal year 2012.

Welcome to Adult Ed GPS! This is a blog devoted to the dissemination of information about statistics and policies relating to adult education. On this site, you will find links to reports, news items relating to policy, data analyses and other items that give you a sense of who we serve, how we serve them and how well we do it. If you want data on a specific topic, you can search by typing the keywords in the search box on the top right of your screen.
Friday, March 15, 2013

Long Island Region Adult Education Statistics 2012
Please find below the 2012 fact sheet for students served in the Long Island Region.
Monday, March 11, 2013
Monday, February 25, 2013
The strangely similar patterns of attendance and age
It's been a while since my last post. This analysis is a little bit of a teaser and raises more questions than it answers. But sometimes those are the best ones.
This analysis was done in response to a query about student retention. That generated the following chart. You will notice a drop off in the hours attended at the higher end of the ABE/ASE range. The ESL attendance seems to be fairly steady across all levels.

So Sandy from NYSED suggested looking at the attendance by age. This generates the following pattern. It is very interesting that both charts look very similar to each other. Does it follow that age predicts attendance?

This analysis was done in response to a query about student retention. That generated the following chart. You will notice a drop off in the hours attended at the higher end of the ABE/ASE range. The ESL attendance seems to be fairly steady across all levels.

So Sandy from NYSED suggested looking at the attendance by age. This generates the following pattern. It is very interesting that both charts look very similar to each other. Does it follow that age predicts attendance?

Thursday, October 25, 2012
Trends in NYS Enrollment fiscal years 2005 to 2011
October 25, 2012


The NRS Deadline is around the corner which means that I get a fresh batch of data to play with. It seemed like the right time to look back over the years to see how our enrollment has changed (or not). Let's look at some charts. ABE stands for Adult Basic Education (reading, writing, math) and ESL stands for English as a Second Language instruction.

This one shows how the enrollment has dropped over the years from a high of 159,408 in fiscal year 2005 to the current 122,833 in fiscal year 2011. The actual numbers are below.

One possible reason for this drop in enrollment are increased costs (while funding has remained the same). However, it is also true that students are receiving better instruction as evidenced by the rise in educational gain percentages. In Fiscal year 2005, the educational gain that we reported, as a state, an overall ed gain percentage of 31% (for the NRS newbies, this means 31% of enrolled students were able to move to a higher educational level based on standardized test scores). In 2011 the overall state ed gain percentage was 54%.
Below are some additional charts looking specifically at enrollments by level for ABE and ESL instruction separately. Again, for the NRS uninitiated, there are 6 ABE levels and 6 ESL levels. Where a student is reported depends on the pre test score she or he received at the beginning of the fiscal year.

To get an overall sense of trends look at how the different levels stack up on the left of the chart. Then look at how they stack up on the right side of the chart. For example, you can see how the ABE 4 level which had the most student in FY05, drops below ABE 3 enrollment in FY11.
Below is ESL enrollment by level across the years.

Any comments or suggestions for further study are welcome.
Tuesday, October 9, 2012
Jobs First Panel Presentation
Please find below the presentation I did on a panel at the Jobs First meeting Friday, October 5th.
Sunday, September 16, 2012
Prospects for DACA GED graduates
The White House and USCIS has made a decision to exercise prosecutorial discretion and exempt certain illegal immigrants from deportation procedures. The beneficiaries of this policy, known as Deferred Action for Child Arrivals, are individuals who came to the United States as children.
The complete fact sheet on DACA (courtesy of the New York Immigration Coalition) can be viewed or downloaded here.
Deferred Action_Info Sheet 8.30.12 Extended Ed
The seventh criteria includes those who may be enrolled in adult education programs. The current period of deferment is two years, after which the participants can apply for another two years. However, for young adults enrolled in adult education programs, the criteria for continued deferment is that they should have gotten their GED.
Is two years enough for adults to get their GED while participating in a GED prep program? We decided to take a look at ASISTS data to see what it tells us.
Using the ASISTS database, we looked at all GED graduates over the years to look at the length of time they had spent in programs before getting their GEDs.
This is a pretty large group of students, nearly 40,000 students over the past 12 years. We included all students regardless of the instruction they received who had achieved the outcome of obtaining a GED. Below are some of the statistics we were able to determine:


The complete fact sheet on DACA (courtesy of the New York Immigration Coalition) can be viewed or downloaded here.
Deferred Action_Info Sheet 8.30.12 Extended Ed
The seventh criteria includes those who may be enrolled in adult education programs. The current period of deferment is two years, after which the participants can apply for another two years. However, for young adults enrolled in adult education programs, the criteria for continued deferment is that they should have gotten their GED.
Is two years enough for adults to get their GED while participating in a GED prep program? We decided to take a look at ASISTS data to see what it tells us.
Using the ASISTS database, we looked at all GED graduates over the years to look at the length of time they had spent in programs before getting their GEDs.
This is a pretty large group of students, nearly 40,000 students over the past 12 years. We included all students regardless of the instruction they received who had achieved the outcome of obtaining a GED. Below are some of the statistics we were able to determine:
- An overwhelming percentage of the students (97%) were Adult Basic Education students, which meant that they received instruction on reading, writing and math. Some students were in classes specifically designed for GED instruction. It is hard to determine the number in GED prep classes because many adult education providers categorize their classes as ABE classes, not GED offerings.
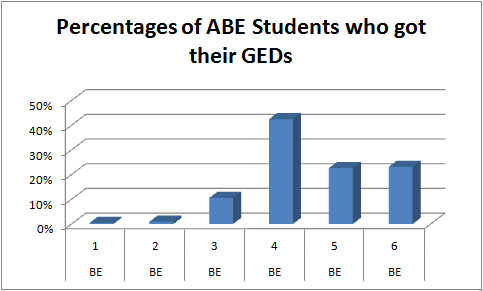
- Contrary to expectations students entering classes at all levels (based on their pretests) received their GEDs. Students entering at level 4 (grade levels 6 - 8.9) formed the largest contingent of successful GED test takers at 42%.

- We also looked at the length of time these students spent in their program before getting their GED. The average number of months before these students got the GED was 9 and the median number of months was about 5. The disparity between the mean and the median indicates that there is a great deal of variability in this measure. But all but 9% of the students got their GED in less than 2 years.
- DACA beneficiaries are more than likely to be ESL (English as a Second Language) students. However, most of the students recorded as getting the GED in ASISTS tend to ABE (Adult Basic Education students) who receive instruction in reading, writing, math and GED preparation. In fact, the data shows that only 3% of GED graduates ever participated in ESL instruction.
- ESL students participate in adult education programs for very different reasons than getting their GED. Do they come back to these programs to get their GEDs? That is a question that is beyond the scope of ASISTS data to answer.
Subscribe to:
Posts (Atom)